


Sales Reports
Revenue, orders and profit across every warehouse and sales channel.
Sep 11 – Oct 10, compared with Aug 12 – Sep 10
Revenue$48,652.80+8.6%vs $44,781.35 in the previous 30 days
Orders699+8.5%vs 644 in the previous 30 days
Units sold2,376+8.8%vs 2,183 in the previous 30 days
Gross profit$12,840.50+8.7%26.4% gross margin
Revenue trend
Revenue per day with the previous period behind it.
Sales by channel
Share of revenue for the selected warehouse.
Top selling products
Best sellers by revenue for the selected period and warehouse.
| # | Product | Units | Revenue | Share |
|---|---|---|---|---|
| 1 | 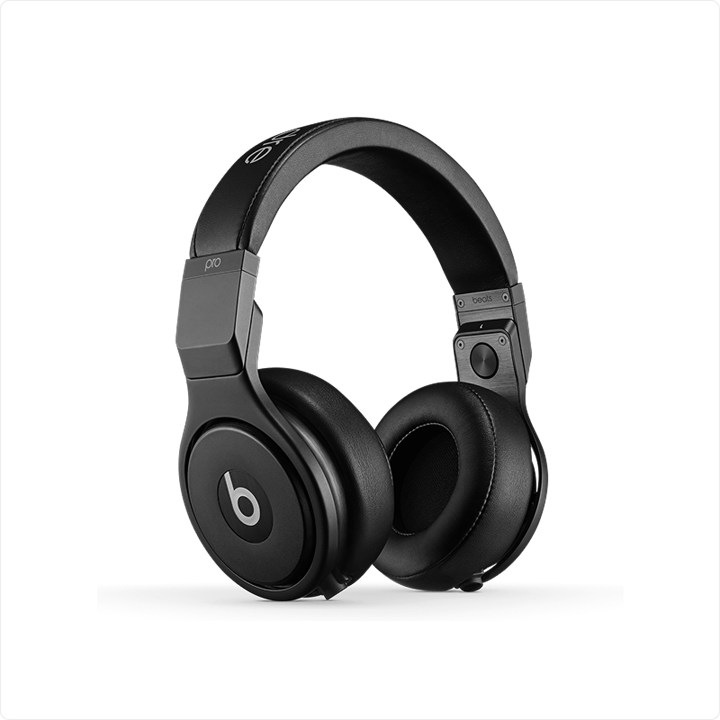 Wireless Noise-Cancelling Headphones Electronics | 30 | $3,973.69 | 8.2% |
| 2 |  Electronics | 42 | $3,414.00 | 7.0% |
| 3 |  Clothing | 27 | $2,007.54 | 4.1% |
| 4 |  Clothing | 29 | $1,956.45 | 4.0% |
| 5 |  Clothing | 21 | $1,867.41 | 3.8% |
| 6 |  Electronics | 21 | $1,818.62 | 3.7% |
| 7 |  Electronics | 6 | $1,714.85 | 3.5% |
| 8 |  Electronics | 57 | $1,632.98 | 3.4% |
| 9 |  Grocery | 850 | $1,528.41 | 3.1% |
| 10 |  Grocery | 57 | $1,417.20 | 2.9% |
Revenue by warehouse
Which sites sell the most.
Sales by warehouse
For the selected period and channel.
| Warehouse | Orders | Revenue | Avg. order | Share |
|---|---|---|---|---|
| Central Warehouse | 195 | $16,819.24 | $86.25 | 34.6% |
| North Distribution Center | 167 | $11,580.69 | $69.35 | 23.8% |
| South Warehouse | 131 | $8,331.26 | $63.60 | 17.1% |
| East Fulfillment Center | 116 | $7,100.89 | $61.21 | 14.6% |
| West Overflow Depot | 90 | $4,820.72 | $53.56 | 9.9% |